Understanding the Size of Containers
It appears that many users are confused with the size of containers reported in the status bar of Swift Explorer.

Some users claim that the indicated container size is much less than what they have uploaded (e.g., the screenshot above shows that the 110,771 objects have a cumulated size of 57.7 GB, while on the local disk they require roughly 260 GB). Others are wondering why the volume of data estimated by the cloud provider (and counting against their quota) is much more than the container size.
The odds are that those disconcerted users have uploaded large files (larger than the segment size, which by default is set at 100 MB in Swift Explorer). Understanding the handling of large objects may rationalize this mystery.
Large Files: the Probable Source of Confusion
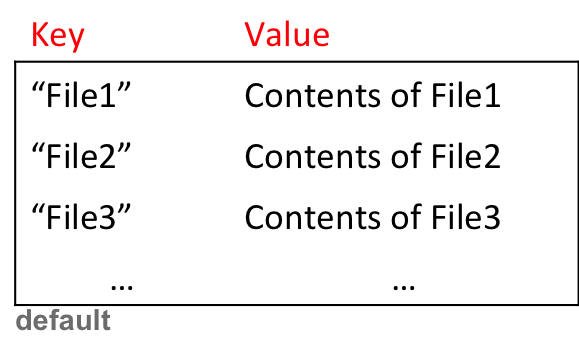
Let’s assume without loss of generality that our container is named default. When a set of files File1, File2, File3, … that have a size smaller than the segment size are uploaded, they expectedly end up in the container default and the space they occupy in default is simply the sum of their sizes.

However, when a large file needs to be segmented, things happen in a different way. The segment objects end up in the container default_segments, and not in default (at least with Swift Explorer and many other SWIFT clients, including the official hubiC’s clients)1. Only an empty object (a manifest object) is created in default that serves as a link to the segment objects (and that takes basically no space). Therefore large files are just seemingly stored in default, and the space they occupy there is negligible.


Consequently, in order to determine the real volume of data in the remote storage, it is necessary to sum both the sizes, the size of default and the size of default_segments.
Using Swift Explorer
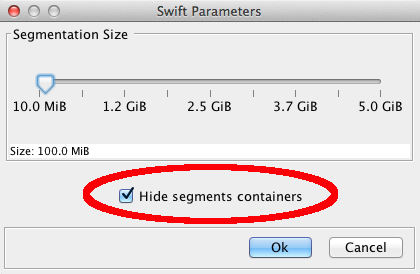
Swift Explorer enables its user to visualize the contents of any container. However, by default the containers reserved for storing segment objects are hidden. In order to see them, the option “Hide segments containers” must be unchecked in the Swift Parameters dialog, which is accessible via the main menu item settings. Bear in mind that this dialog can only be opened when we are not logged in.

That way, one can see the size of the memory taken by the segment objects. Note that in practice, it is recommended to leave the segments containers hidden; after checking the size, you probably should log out and set back the option to hide those containers.
-
Note that OpenStack does not impose any restrictions on how to deal with large objects, and thus this is implementation dependant. We can imagine that some clients are storing the segment objects in the same container as the “objects” container (in such an implementation things might get messy, but there should be no confusion with the reported sizes, barring any other reasons for discrepancies such as bugs and the like). ↩