Japan—Balance of Trade & Energy
In this kernel, we examine the balance of trade—also referred to as net exports—of Japan. In particular, we take a closer look at the energy imports, which appears to have a great influence on the overall balance. In addition to the Kaggle’s Japan Trade Statistics dataset, we also use historical exchange rates (JPY/USD) and oil prices.
The Dataset
The Trade Statistics of Japan’s website, section Abbreviation of unit, defines the various units found in the two columns Unit1 and Unit2. The Glossary - Trade Statistics of Japan provides useful information. In particular, Q1, Q2, Unit1 and Unit2 are discussed; and the Statistical Code (columns hs2, hs4, hs6 andhs9) is deciphered. Basically, the Harmonized System (HS) is used.
There are HS codes found in the dataset for which the name is unknown—for instance, the four-digit codes (hs4) 0503, 0509, 1402, 1403, 1519, 2527 … 9009, 9203, 9204, 9501, 9502, 9620 have no name associated.
Another point worth mentioning is that the trade records of some commodities in the dataset are given only in recent years (that seems to be the case for crude oil1, for example).
Imports / Exports
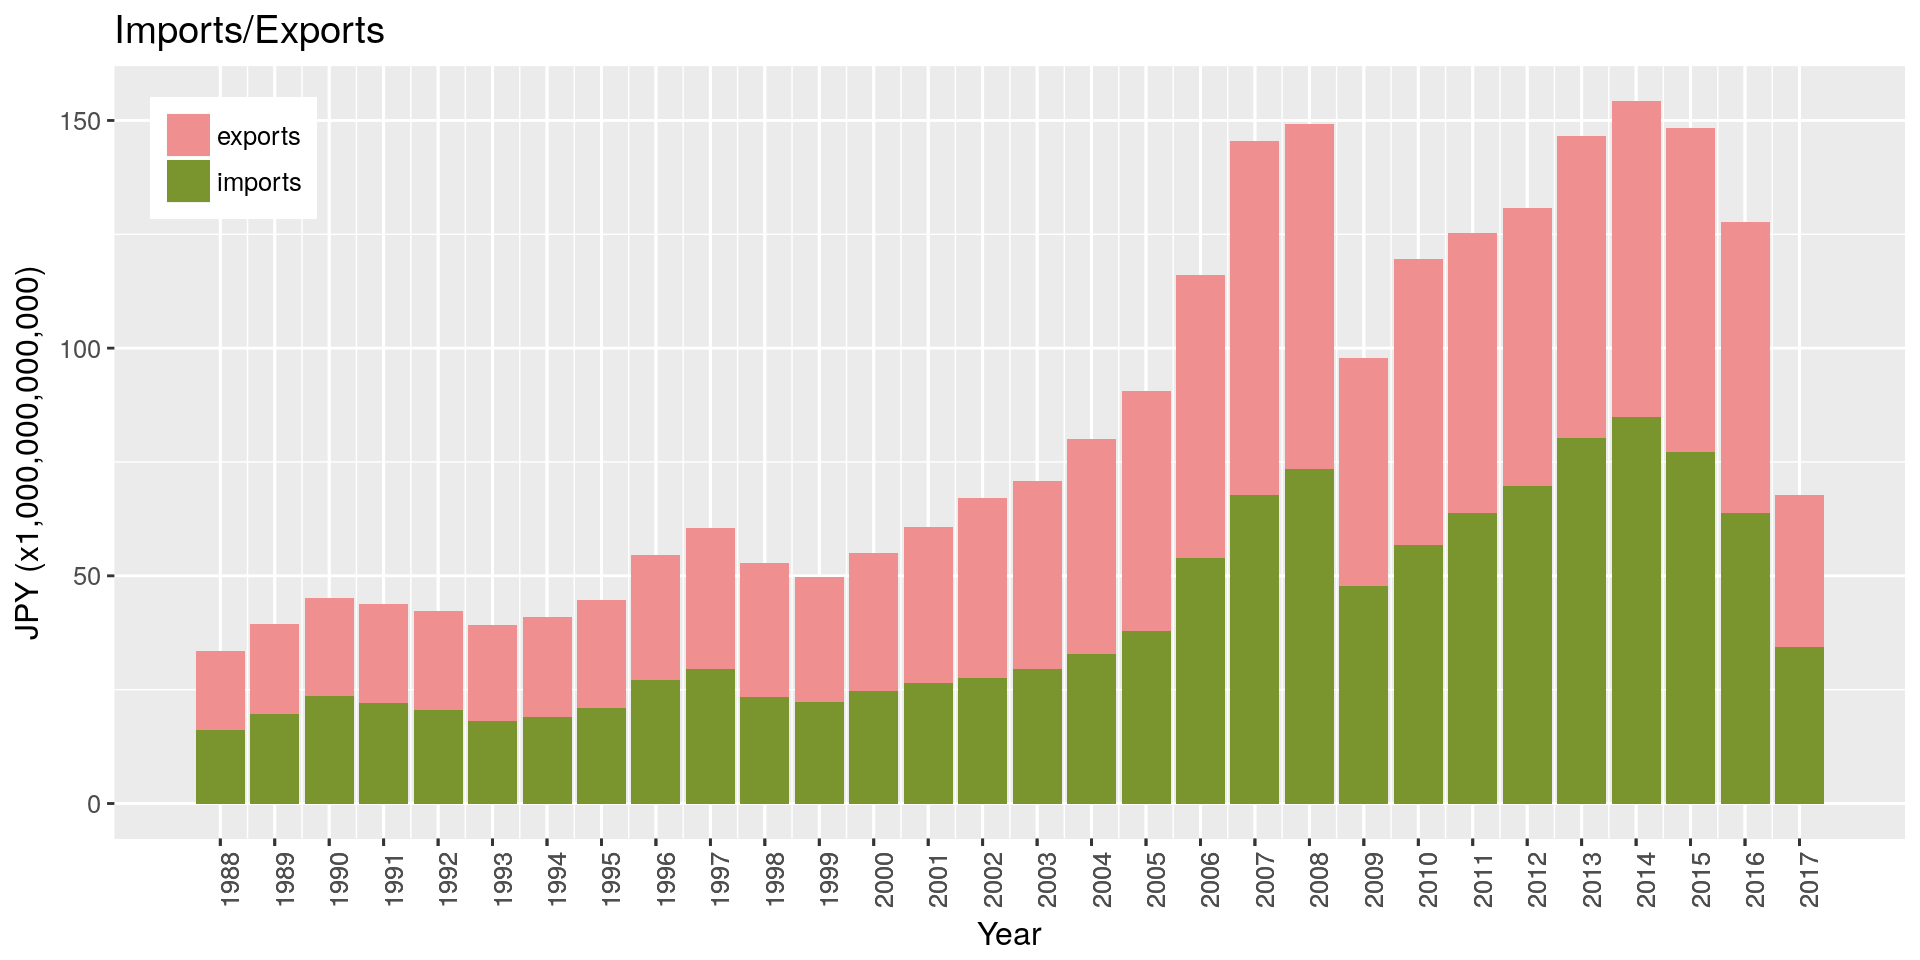
We observe a marked deterioration of the balance, which even turns negative in 2011. The following graph (Balance of Trade) highlights this decline. Other than that, we can observe that after a prolonged period of expansion, both the imports and exports plunged in 2009—consistently with the global economic contraction caused by the financial crisis of 2008–2009—before steadily recovering until 2015, where, again, a downturn occurred as Japan entered into recession (Harding, 2015).
(Note that 2017 is still ongoing, and since these are absolute values, we cannot comment on the low level observed for 2017.)
Balance of Trade
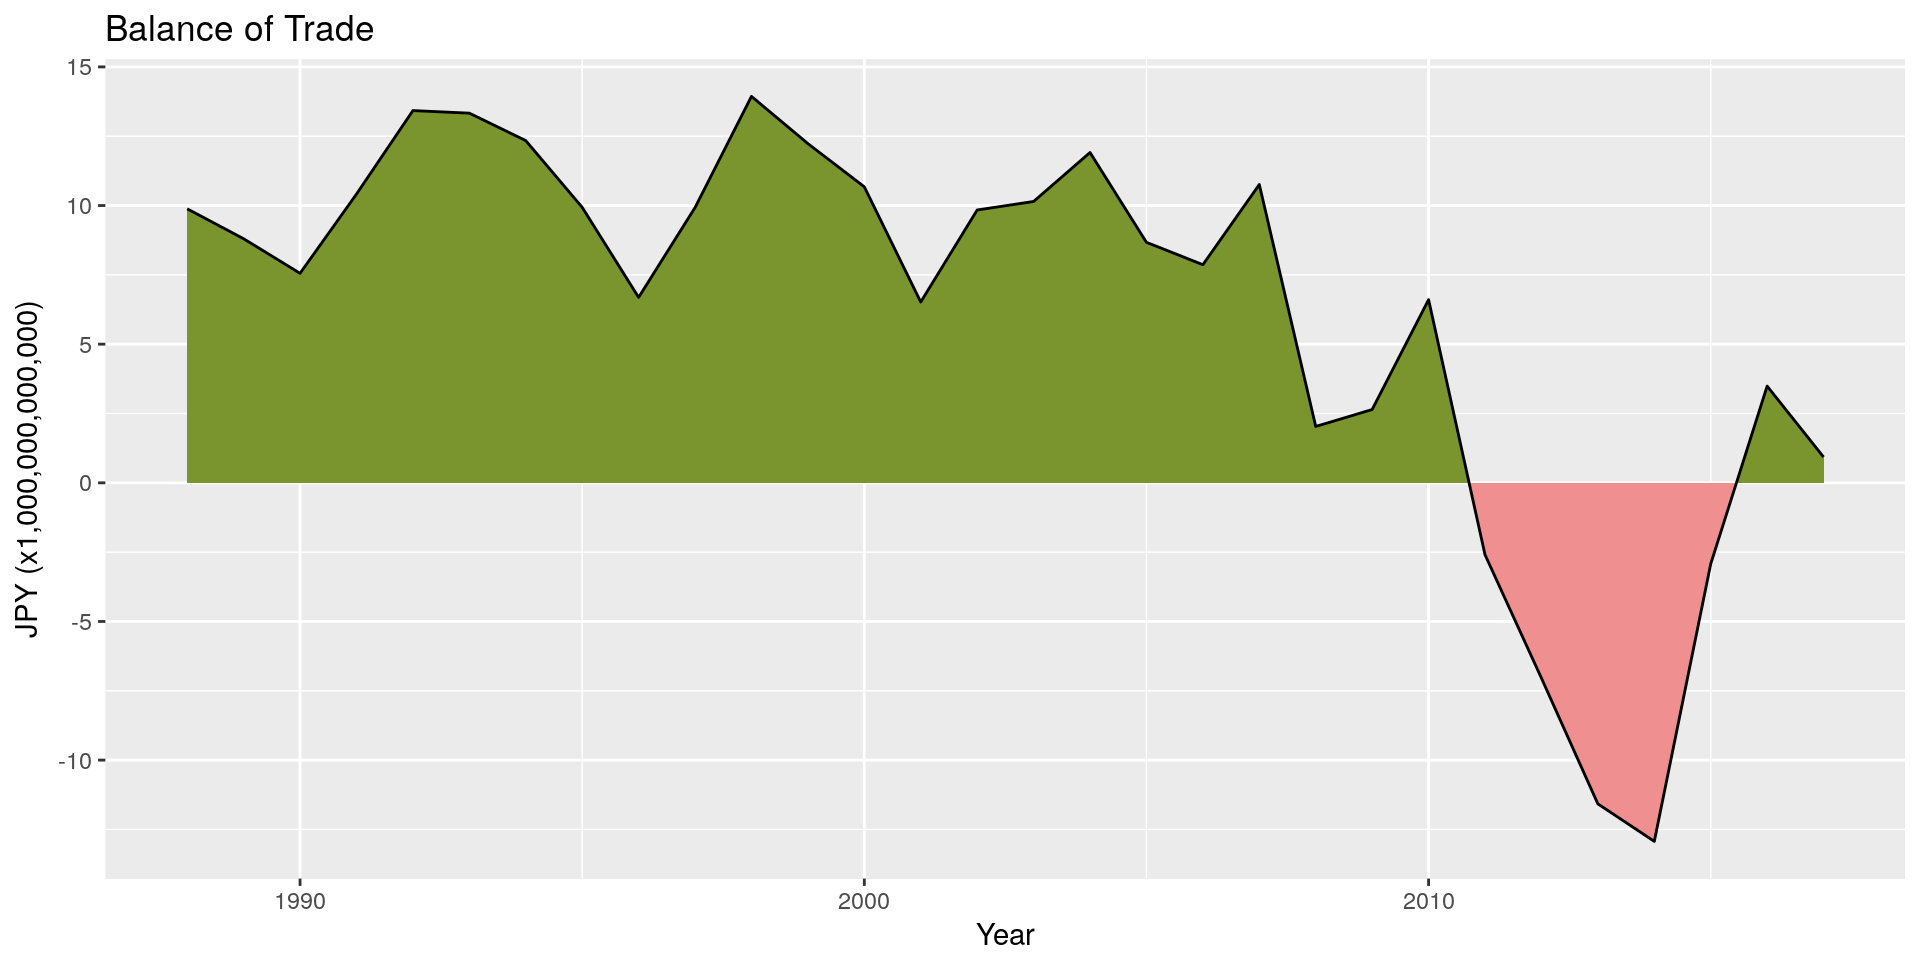
We can observe a drastic deterioration of the balance during 2011–2013, followed by a lightning recovery. Let’s take a look at the post-tsunami period (early 2011–2016) to better understand the mechanism behind the plummeting of net exports.
Yearly Variations
To understand the causes of this deterioration, let’s have a closer look at both the variation in imports (especially the increasing ones) and the variation in exports (especially the decreasing ones).
Imports
The following table presents the top variations—ordered decreasingly by Δ(10, 11), Δ(11, 12), Δ(12, 13), Δ(13, 14), Δ(14, 15), Δ(15, 16). It unequivocally highlights a massive increase in energy imports. The fuel energy imports consistently varied one order of magnitude more than other items from 2010 to 2013. From 2014 to now, we can observe a slowdown, and even a reverse, of the trend; yet the cumulative increase over the three-year period past Fukushima cataclysm is not recovered.
Energy imports variation accounts for 48.9% of the total net exports variation between 2010 and 2011.
| Harmonized Commodity Description | Δ(10, 11) | Δ(11, 12) | Δ(12, 13) | Δ(13, 14) | Δ(14, 15) | Δ(15, 16) |
|---|---|---|---|---|---|---|
| Mineral fuels mineral oils and products of their distillation; bituminous substances; mineral waxes. | 4,146,379 | 3,800,259 | 3,340,290 | 247,700 | -9,493,216 | -6,221,963 |
| Ores slag and ash. | 288,037 | -265,757 | 244,592 | 111,118 | -716,337 | -625,784 |
| Organic chemicals. | 232,324 | 6,675 | 117,542 | 30,450 | 108,682 | -279,066 |
| Inorganic chemicals; organic or inorganic compounds of precious metals of rare-earth metals of radioactive elements or of isotopes. | 217,611 | -287,884 | -18,176 | 112,305 | 8,069 | -168,933 |
| Machines | 183,923 | 40,810 | 959,246 | 799,278 | 325,243 | -810,768 |
| Pharmaceutical products. | 171,615 | 247,986 | 198,741 | 67,663 | 700,887 | -163,876 |
| Iron and steel. | 161,266 | -170,279 | -15,087 | 181,501 | -153,274 | -163,217 |
| Articles of apparel and clothing accessories not knitted or crocheted. | 159,703 | 44,678 | 261,524 | -6,587 | 73,563 | -187,527 |
Exports
The two top rows of the table indicate a drastic slowdown of two of the industries in which Japan has a competitive advantage (namely the electronic industry and the automotive industry). Those alone explain 25.6% of the total net exports variation between 2010 and 2011.
| Harmonized Commodity Description | Δ(10, 11) | Δ(11, 12) | Δ(12, 13) | Δ(13, 14) | Δ(14, 15) | Δ(15, 16) |
|---|---|---|---|---|---|---|
| Electrical machinery and equipment and parts thereof; sound recorders and reproducers television image and sound recorders and reproducers and parts and accessories of such articles. | -1,101,489 | 157,154 | 516,996 | 453,611 | 549,774 | -1,090,409 |
| Vehicles other than railway or tramway rolling-stock and parts and accessories thereof. | -1,070,504 | 1,289,177 | 1,490,488 | 597,522 | 1,127,884 | -1,185,035 |
| Ships boats and floating structures. | -205,103 | -300,204 | -273,513 | -133,368 | 12,728 | -236,500 |
| Plastics and articles thereof. | -143,501 | -142,505 | 231,746 | 167,382 | 46,813 | -268,419 |
| Copper and articles thereof. | -53,250 | -1,077 | 116,945 | -9,168 | -25,801 | -126,280 |
| Paper and paperboard; articles of paper pulp of paper or of paperboard. | -50,107 | -16,734 | 31,773 | 21,395 | 25,485 | -10,900 |
| Iron and steel. | -45,465 | -207,013 | 295,457 | 89,436 | -206,991 | -677,381 |
| Glass and glassware. | -39,076 | -37,979 | -24,162 | -85,971 | -35,052 | -19,883 |
Energy Crisis
The previous section suggests that the downward trend of the net exports starting between 2010 and 2011 and sustained until 2014 is largely due to an increase in energy imports. The link to the shutdown of a number of nuclear plants in the wake of the tragic Fukushima disaster is quite evident.
In this section we examine the imports/exports of energy. It seems that the data regarding crude oil are available only from 2006 onwards (HS Code 270900100 and 270900900)1.
In this section we consider the following items:
| HS Code | Description |
|---|---|
| 2701 | Coal; briquettes ovoids and similar solid fuels manufactured from coal |
| 2709 | Petroleum oils and oils obtained from bituminous minerals crude |
| 2710 | Petroleum oils and oils obtained from bituminous minerals other than crude; preparations not elsewhere specified or included containing by weight 70% or more of petroleum oils or of oils obtained from bituminous minerals these oils being the basic constituents of the preparations; waste oils |
| 2711 | Petroleum gases and other gaseous hydrocarbons |
HS Code 2701 will be referred to as coal; 2709, 2710 as oil and 2711 as gas. Other items in the chapter 27 (Mineral fuels mineral oils and products of their distillation; bituminous substances; mineral waxes.) could be relevant, though.
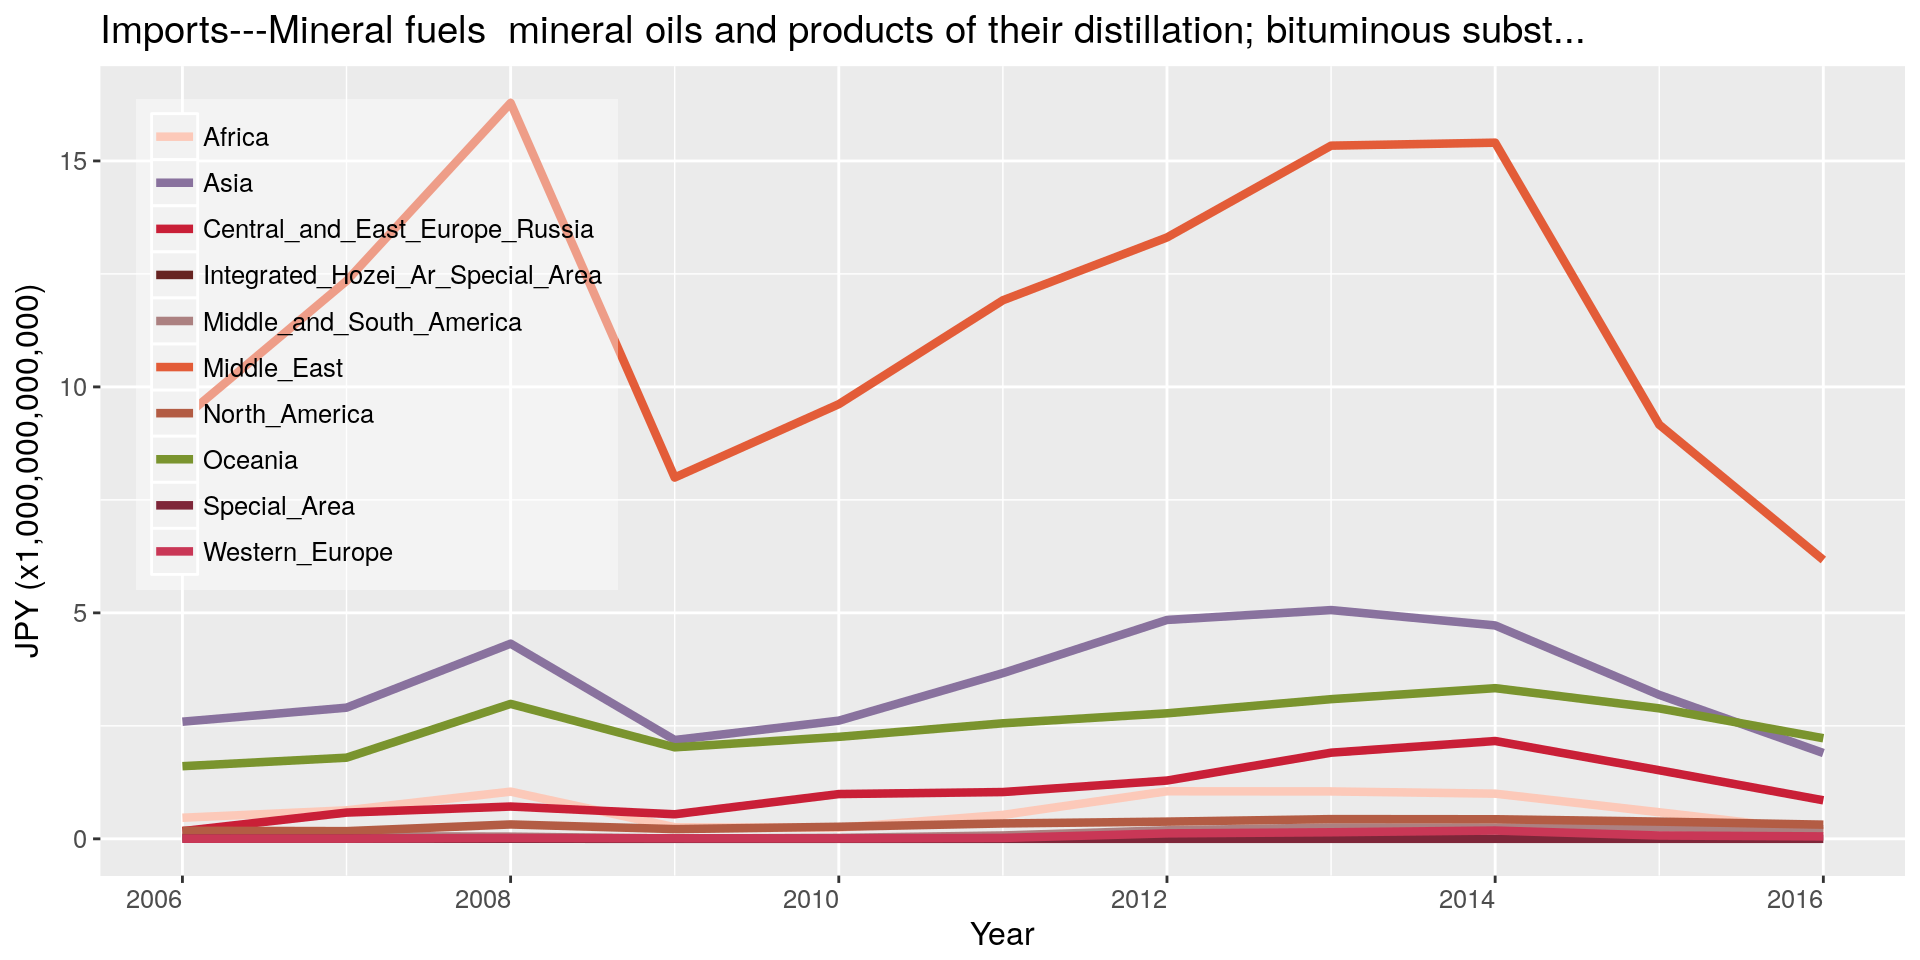
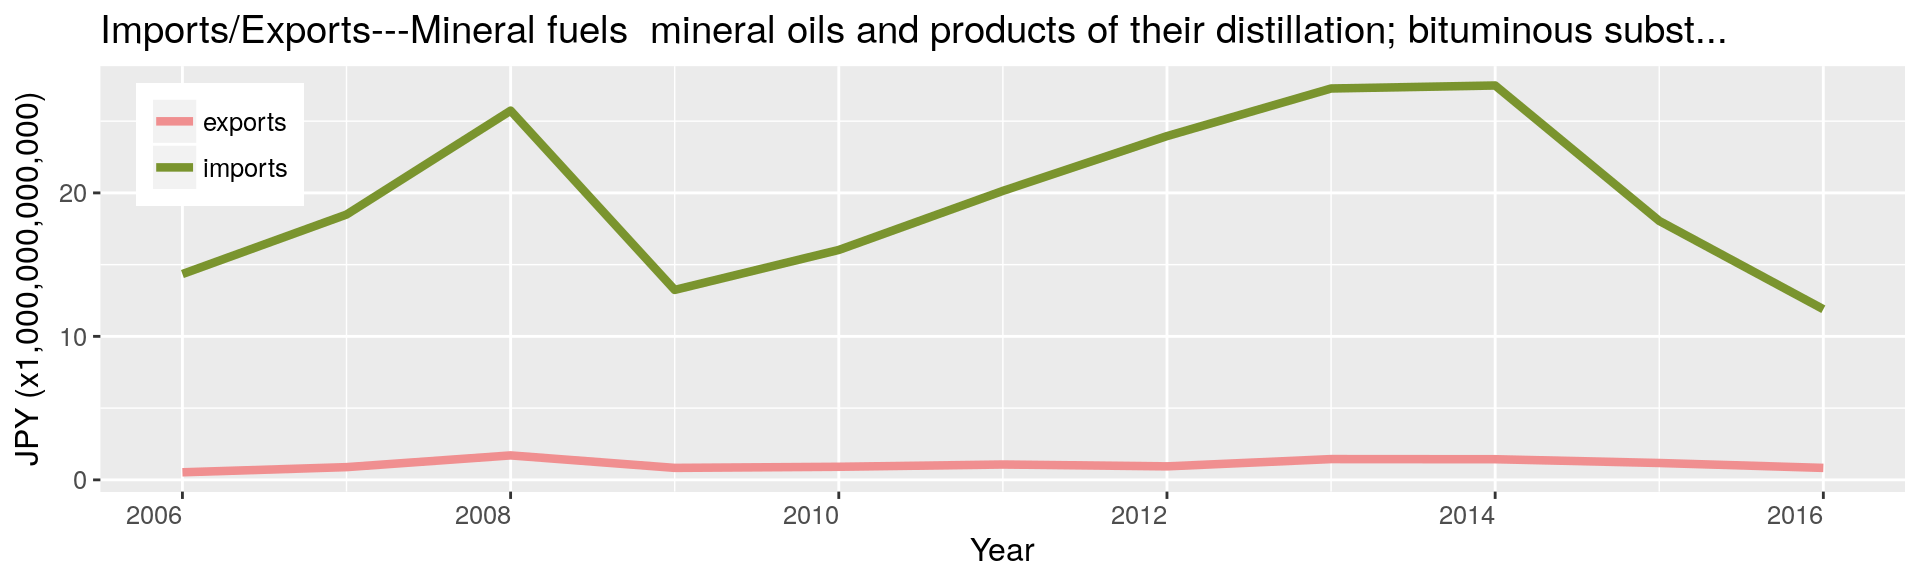
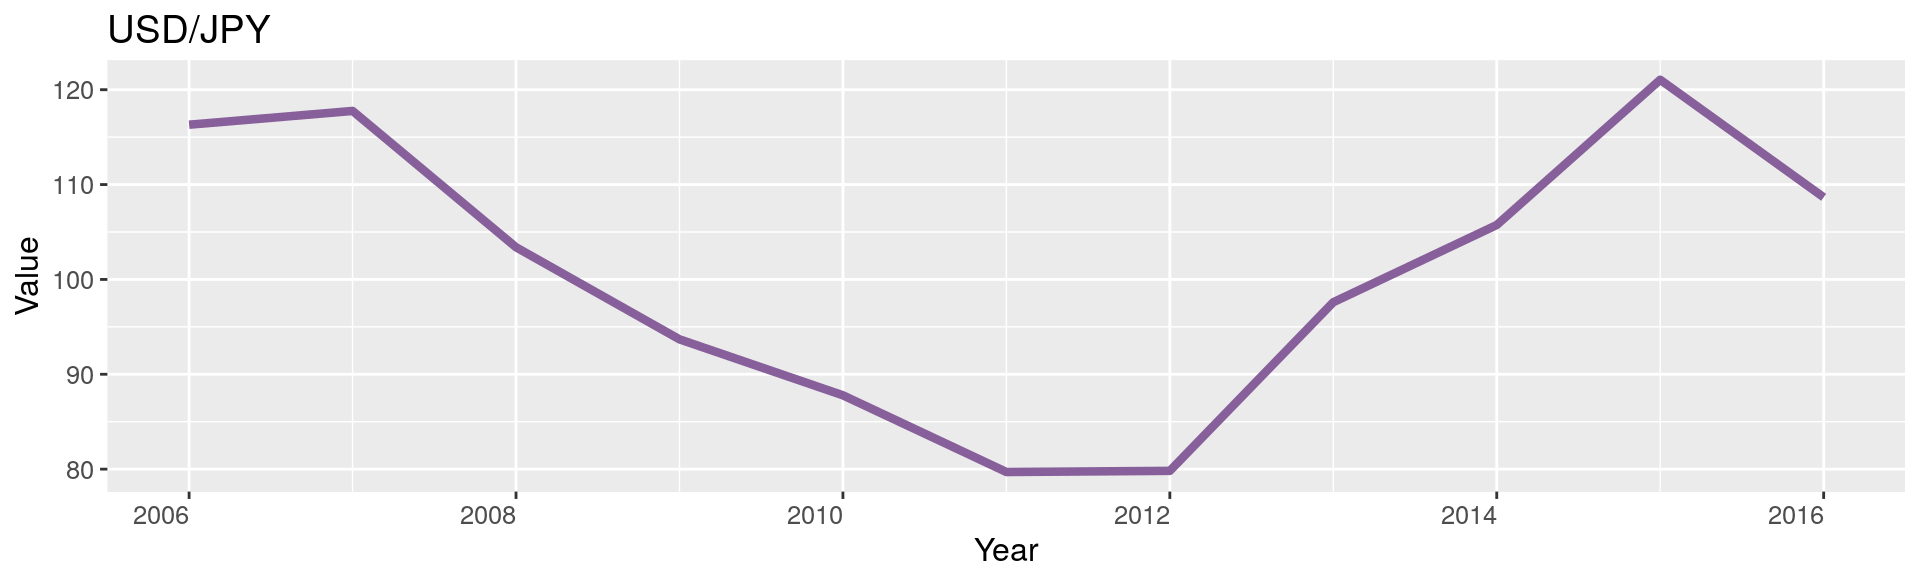
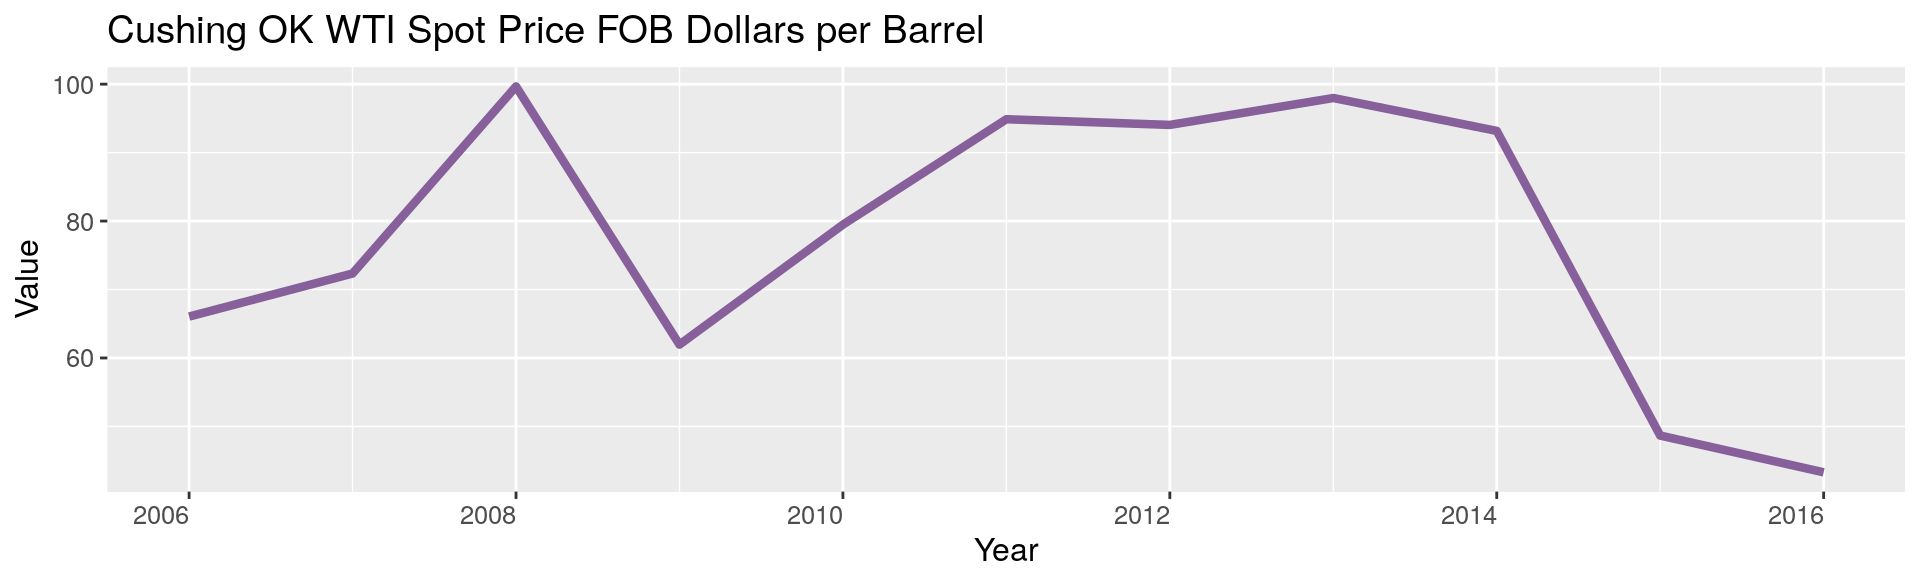
Those curves are somewhat misleading because they show imports in terms of JPY—which has a floating exchange rate; and in particular, which is not pegged to the USD—while most commodities are denominated in USD (it is certainly true for oil). As a result, a variation in the exchange rate alone may very well influence the net exports. Besides, oil price is also subject to volatility. Consequently, the curves above can depict large movements without necessarily any corresponding changes in the traded volume.
Although it is difficult to infer the variation in need of importing (fossil) energy from those graphs, the second plot illustrates that Japan is not exporting much energy.
Estimation of the Number of Barrels (“Equivalent”)
We look at the JPY/USD exchange rate and barrel price fluctuations to estimate the imports of energy in terms of the number of barrels, i.e., how many barrels of crude oil could have been purchased with the reported value of imported energy (the Value column, for which the unit is 1,000,000 JPY).
It must be borne in mind that this is a very rough estimation, as we assume that all imports reported as having their first four digits in the harmonized system code (HS Code) in {2701, 2709, 2710, 2711} are costing the same as crude oil (which is certainly not the case).
We got an estimation of crude oil price from Spot Prices for Crude Oil and Petroleum Products—those data are in the public domain. The JPY/USD foreign exchange rates were retrieved from: Board of Governors of the Federal Reserve System (US), Japan / U.S. Foreign Exchange Rate [DEXJPUS], retrieved from FRED, Federal Reserve Bank of St. Louis; fred.stlouisfed.org, August 11, 2017—in accordance with the Terms of Use.
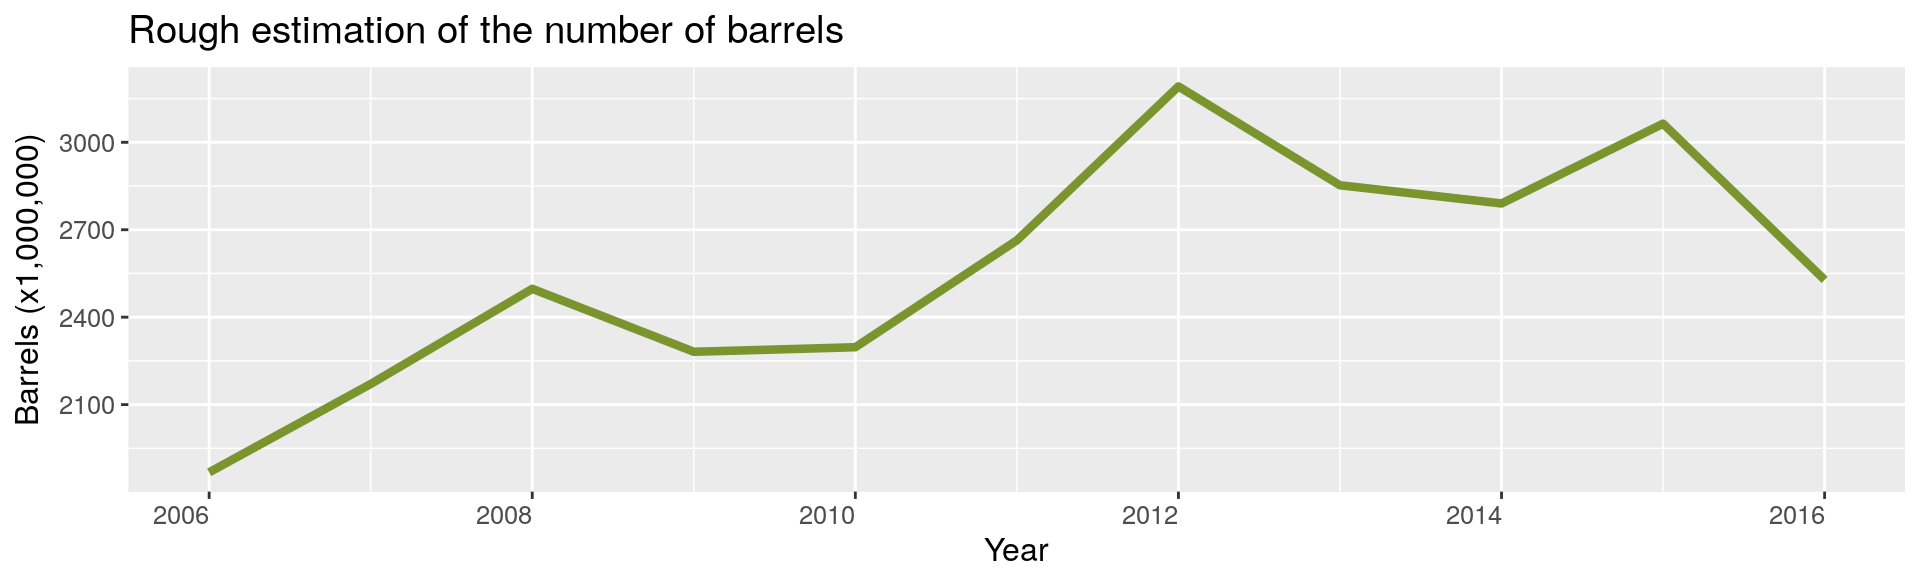
This latter plot illustrates without much ambiguity the soaring of energy imports following the devastating Tohoku earthquake of early 2011, suggesting an unprecedented energy crisis (at least, as far as the data goes). This shortage of energy pushing imports upwards can easily be explained by the shutdown of nearly all nuclear reactors of the archipelagos (OECD, 2015, p. 24), which were producing 30% of the country electricity at that time (WNA, 2017).
Quantity of Imported Energy
The columns Unit1, Unit2, Q1 and Q2 allow us to estimate the volume or mass of fossil energy imported. We can observe that the quantities Q1 and Q2 are expressed in different units (specified by Unit1 and Unit2, respectively).
There are some missing quantities. Moreover, the presence of suspiciously high value (outliers) for the ratio Value/(Q1 + Q2) suggests the possibility of having some corrupted data.
We first convert all the quantities to the same unit (Metric Tons, MT).
A Brief Look at the Cost per Metric Ton
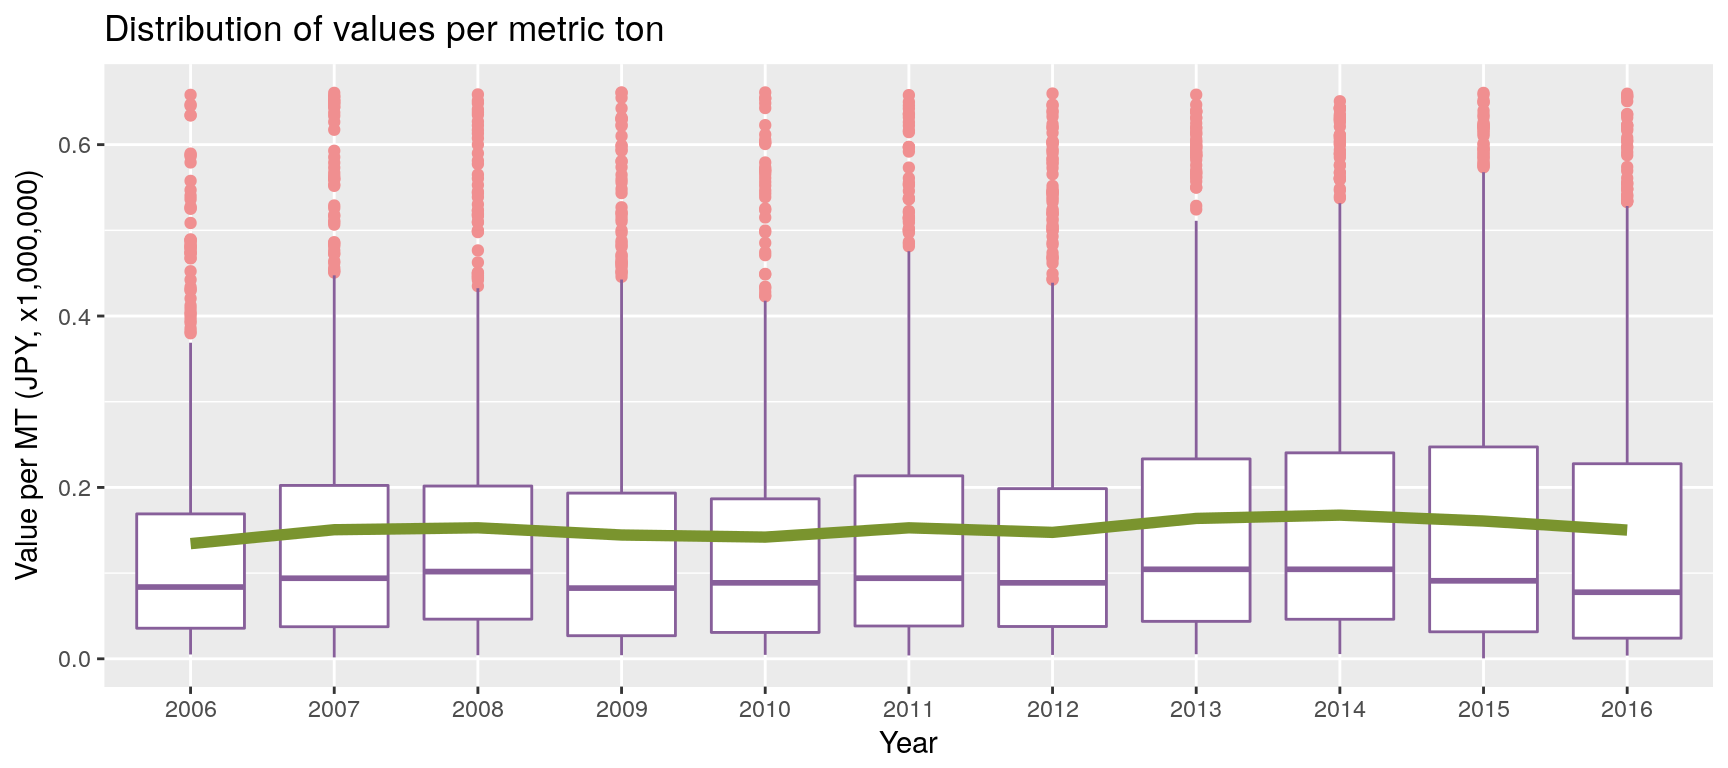
This plot shows the value in JPY per MT of energy. Note that there are missing quantities (i.e., Q1 + Q2 = 0); we ignored the values associated with those missing quantities—a total amount of 1,022,053,668 JPY (or 0.00033% of the total value).
Besides, there seems to be some outliers (some cost per unit are suspiciously exorbitant, and are perhaps due to errors made while reporting the quantities). We rely on the Hampel’s test to compute the maximum threshold above which values are declared spurious. One can find further details about the Hampel’s test for outlier detection in Scrub data with scale-invariant nonlinear digital filters. The total value ignored amounts to 66,933,333,025 JPY (or 0.021% of the total value).
Overall, the percentage of anomalies is small, but non-negligible. The problem is what shall we think of the seemingly non-anomalistic values? The quantities (or the values, or both) seem to be prone to ill-reporting. Perhaps many other errors were made, but because they remain in a realistic range, there is no ground to be suspicious of them.
If there are indeed some errors, we are inclined to believe that the reported values (in JPY) are more often correct than the reported associated quantities (although we do not have any tangible argument to support this belief; presumably, during the customs declaration process, the value and nature of an item might be more scrutinized than the precise quantity).
To deal with this matter, we recommend considering the conclusions based on quantities loosely.
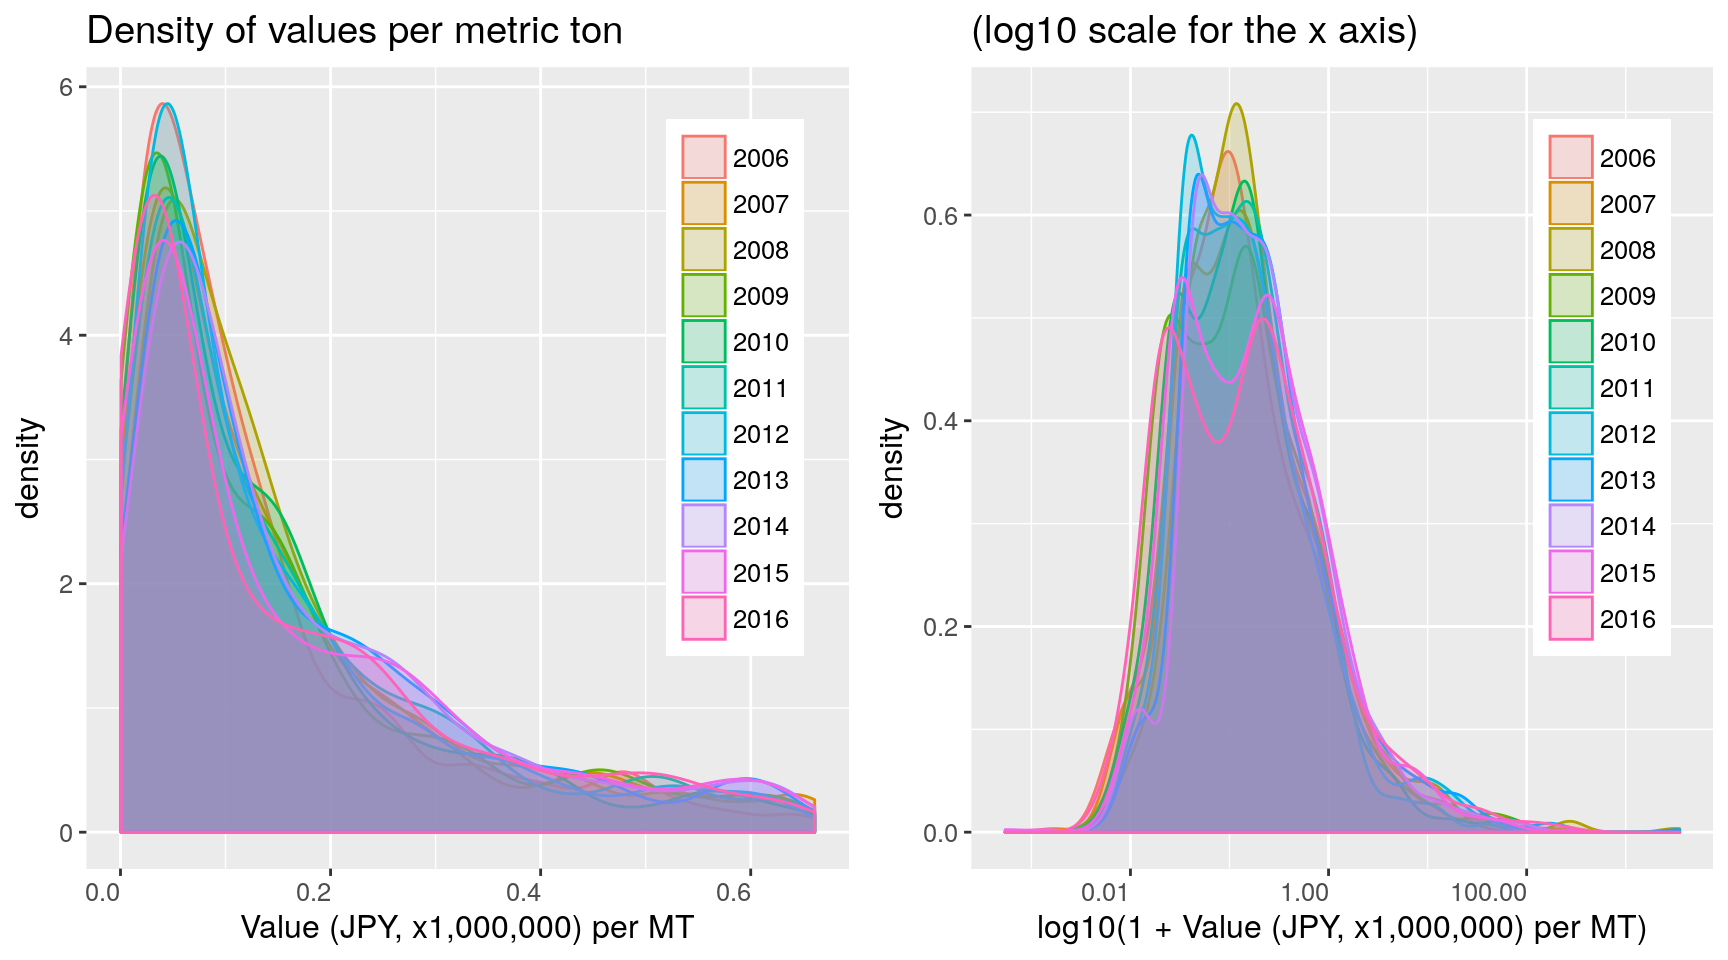
Note that in the left density plot (linear scale), the outliers (detected using the Hampel’s test) are ignored; whereas the right density plot (log10 scale) includes the entire range (note that the x axis with such a range illustrates the amplitude of some outliers).
The cost per MT of imported energy varies quite significantly during each year; however, the mean and median are not that volatile from one year to another.
Energy Imports in Metric Tons
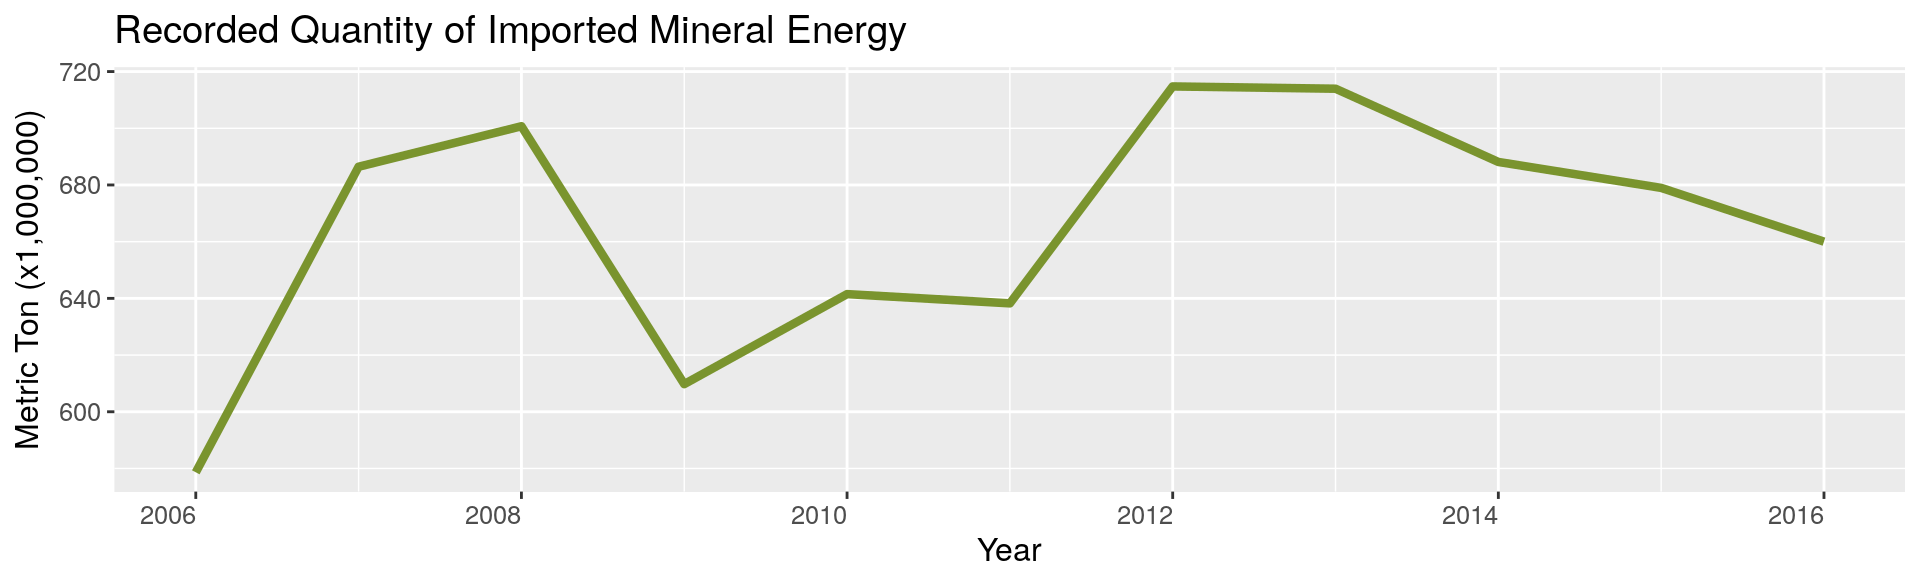
This curve reveals a seemingly contradictory trend with our rough estimation of energy imports in terms of the number of barrels, for it can be observed that the (physical) quantity of imported fossil energy marginally decreased between 2010 and 2011. Let’s further investigate this perplexing phenomenon in the next subsection.
Estimation of Energy Imports in Megajoules
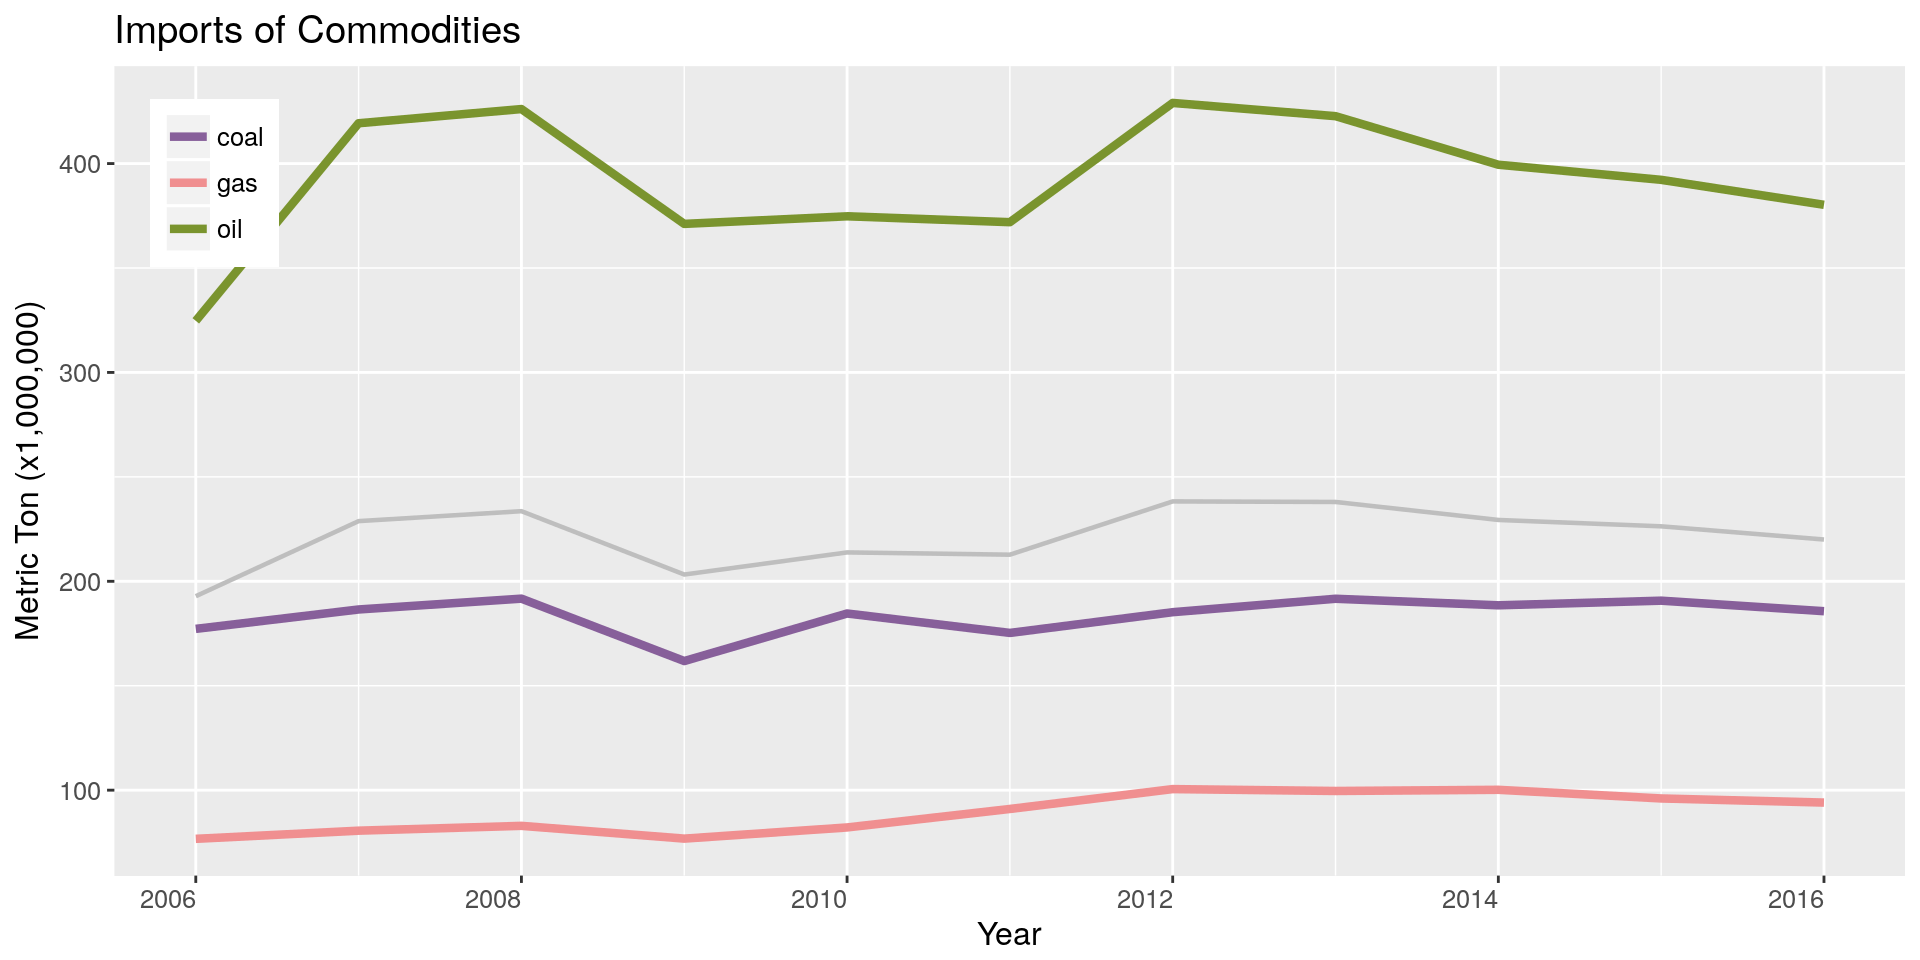
We can observe that immediately in the aftermath of the Fukushima nuclear disaster (that occurred in the first quarter of 2011), gas imports increased (8,853,602 MT between 2010 and 2011—or an increase of 10.8%); oil imports more-or-less stagnated (-2,818,276 MT—or -0.752%); whereas coal imports decreased (-9,294,321 MT—or -5.04%). This observation may explain, to some extent, the seemingly conflicting tendencies between the two curves above, for the coal has a much lower energy density than the two other commodities.
Given the shortage in electricity production due to the shutdown of nuclear power plants (OECD, 2015), the decrease in coal imports is rather counterintuitive. The principal causes for this trend are a decline in crude steel production combined with the “inability to operate five coal-fired thermal power plants with a total generating capacity of 7.05 megawatts in the areas . . ., which were affected by the Great East Japan Earthquake” (Morita, 2012, p. 1). Most of the thermal power plants resumed operation by 2012, fueling coal demand (Morita, 2012).
Let’s make a back-of-the-envelope estimation of the energy imports in Joule using the values found in Wikipedia—Energy density:
- coal’s specific energy ranges from 26 to 33 MJ/kg (let’s take 29.5 MJ/kg)
- gas’ specific energy is 53.6 MJ/kg
- oil’s specific energy is 46.4 MJ/kg
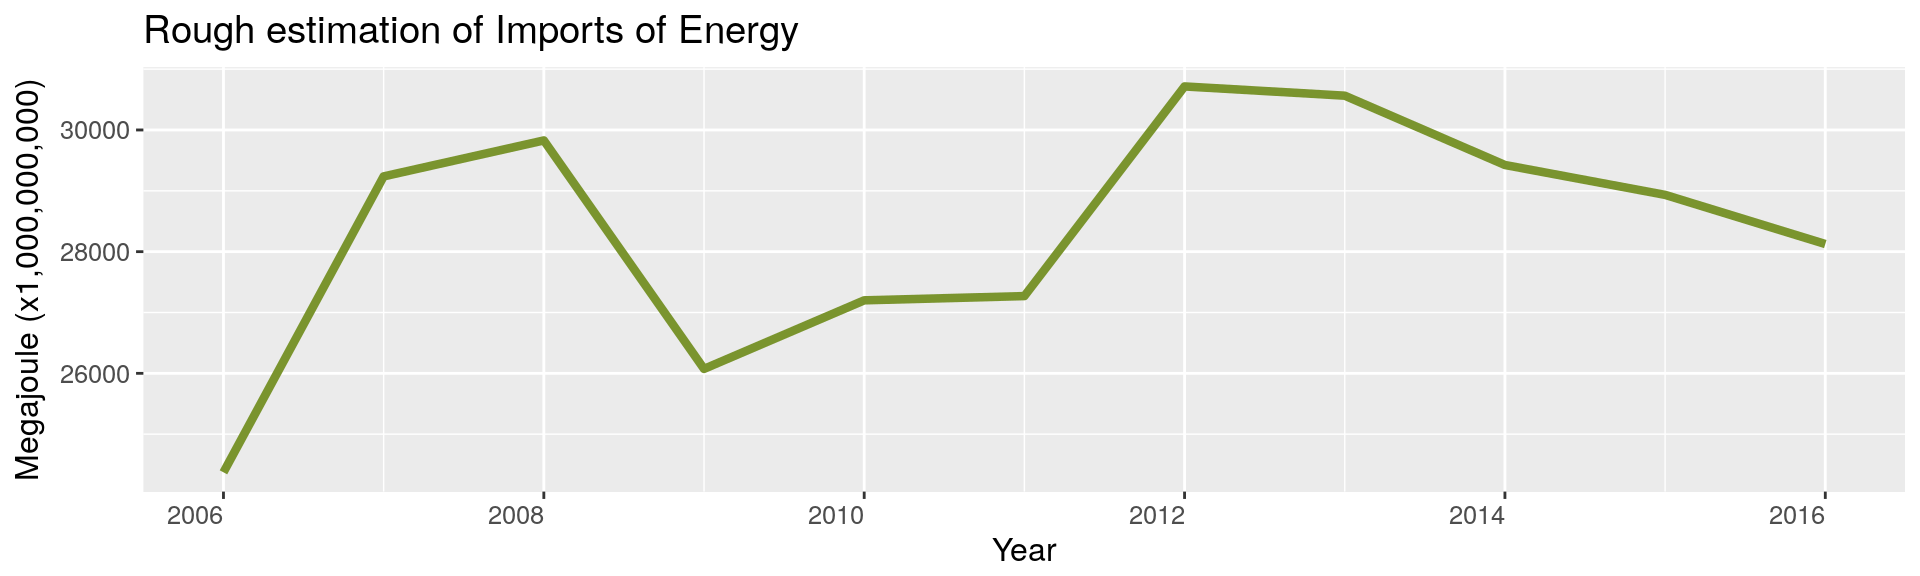
Contrasting Estimations & Other Remarks
Let’s contrast the two estimations—the previous one in terms of the number of barrels, and this one, in megajoules.
Although the peak of 2008 is exacerbated in the latter compared to the former, the two estimations are fairly consistent. In the latter, only a very slight—barely noticeable—increase is observed between 2010 and 2011, then a steep surge occurred between 2011 and 2012; whereas the former showed a quasi-linear increase between 2010 and 2012. (Note that the former is more in line with the JPY values, that show a marked increase between 2010 and 2011; see Section Yearly Variations).
It is important to remember that both estimations are very rough, and based on assumptions that can vastly diverge from the reality. Furthermore, the reported quantities seem to have some anomalies (missing values and apparently spurious values when contrasted with the associated pecuniary values—thus, at least one of them might be wrong). With that in mind, it might not be excessively pertinent to focus on details; stylized tendencies, on the other hand, may bear more relevance.
Crisis Mitigation
All the curves above concur in the general tendency that fossil energy imports surged in 2011–2012, immediately after the Fukushima disaster—for which one of the principal reasons is the shutdown of almost all nuclear reactors in the country (OECD, 2015; WNA, 2017)—but then, from 2014 to 2016 (and probably 2017), this trend reversed and the imports of fossil energy returned to a level comparable with the one prior to the disaster. Japan is known for not having the natural resources to fulfill its needs in fossil energy; therefore a lessening in imports means a decrease in reliance.
This observation suggests a good management of the crisis. Various reports and articles on this matter agree that the main steps that led to a successful mitigation include (i) the reopening of nuclear plants—after being certified by new safety standards; (ii) the focus on renewable energy and (iii) measures/efforts for reducing electricity consumption (Soble, 2014; OECD, 2015; DeWit, 2015).
Regarding the first point, it appears that only a very few reactors have been indeed restarted. A recent Reuters’ survey reveals that only three reactors are active at the end of 2016 (TABLE-Japan nuclear reactor operations). Many reactors were not shut down right after the disaster (but in 2012), two reactors were restarted in 2012, but then shut down again in 2013. Only in 2015 and 2016 three reactors have been reactivated (those events are nicely illustrated in the Wikipedia’s Nuclear power in Japan—Japan’s nuclear reactors timeline).
Let’s take a quick look at the trade statistics data to find patterns that would corroborate those steps.
Trades Related to Nuclear Energy
| HS Code | Description |
|---|---|
| 2612 | Uranium or thorium ores and concentrates |
| 2844 | Radioactive chemical elements and radioactive isotopes (including the fissile or fertile chemical elements and isotopes) and their compounds; mixtures and residues containing these products |
| 2845 | Isotopes other than those of heading 28.44; compounds inorganic or organic of such isotopes whether or not chemically defined |
| 8109 | Zirconium and articles thereof including waste and scrap |
| 8401 | Nuclear reactors; fuel elements (cartridges) non-irradiated for nuclear reactors; machinery and apparatus for isotopic separation. |
The HS Codes 261210, 261220, 284410, 284420, 284430, 284440, 284450, 284510, 284590, 810990, 840110, 840120, 840130, 840140 seem to be nuclear-related (Versino, 2012).
![]()
The downturn right after the tragic Fukushima accident is quite remarkable. The nuclear-energy-related imports have been steadily (and rather rapidly) declining, without any sign of an upturn (as of 2016). (By contrast, exports have been keeping a flat trajectory; however, given that they are quite negligible, there is not much room for a noticeable slowdown.)
Bottom line, it remains difficult to rationalize any activities from this observed trend that would explain a reduction in fossil energy imports. (Note that the Reuters’ survey, indicating that only three reactors—out of the 42 that have not been decommissioned—are in operation at the end of 2016, is consistent with our observations.)
Trades Related to Renewable Energy
| HS Code | Description |
|---|---|
| 7308 | Structures (excluding prefabricated buildings of heading 94.06) and parts of structures (for example bridges and bridge-sections lock-gates towers lattice masts roofs roofing frame-works doors and windows and their frames and thresholds for doors shutters balustrades pillars and columns) of iron or steel; plates rods angles shapes sections tubes and the like prepared for use in structures of iron or steel |
| 8482 | Ball or roller bearings |
| 8501 | Electric motors and generators(excluding generating sets) |
| 8502 | Electric generating sets and rotary converters |
The HS Codes 8502, 8501, 8482, 7308 seem to be related to renewable energy (Wind, 2009).
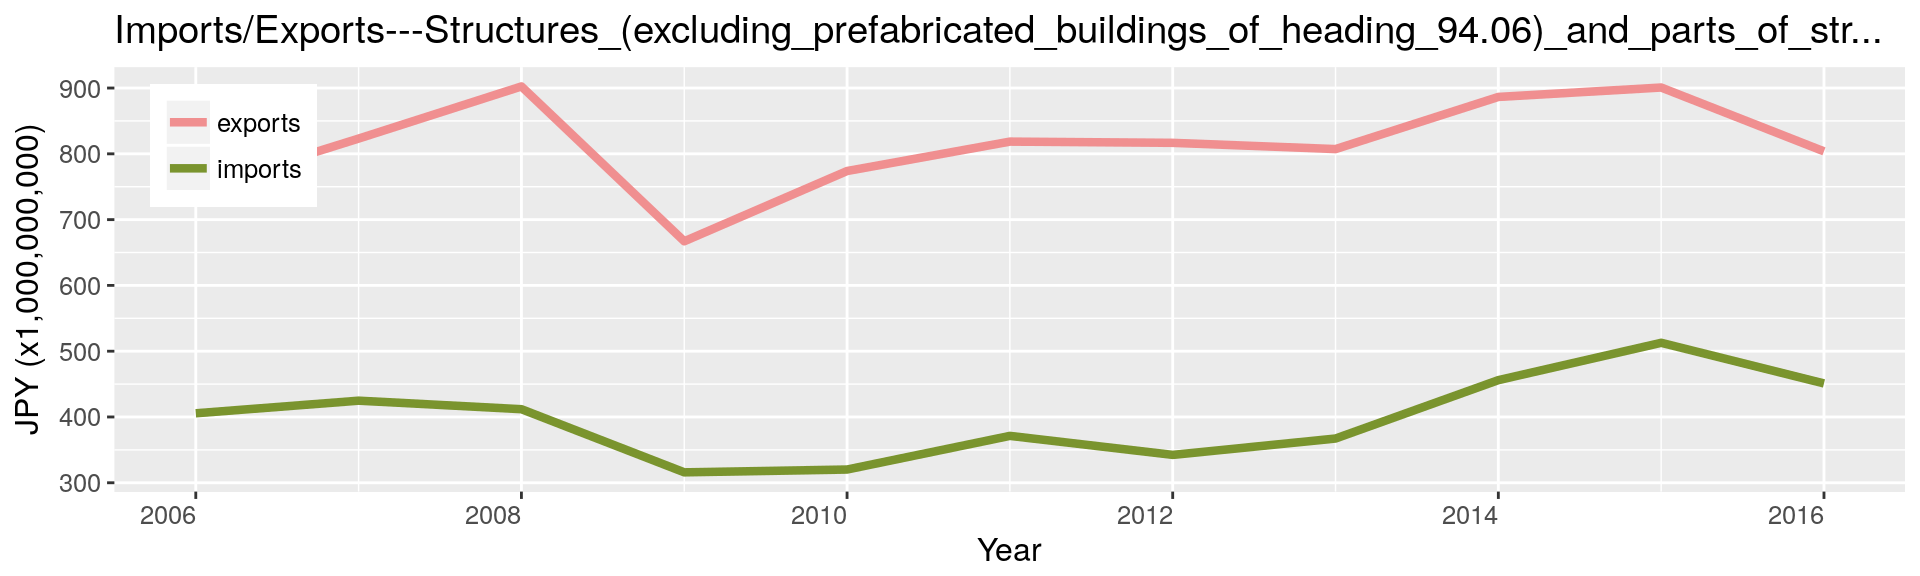
The curves above unambiguously denote a slight but steady increase in renewable energy activities from even before the Tohoku earthquake (right after a slump presumably due to the financial crisis of 2008–2009). It is worth noting here that the level of exports surpasses, and by far, the level of imports—unlike all other energy sources presented throughout this kernel—suggesting that Japan has some competitive advantages in that sector. The increase may be (partly) explained by the slow recovery of the global economy from the 2008–2009 financial crash. The unit being in JPY, foreign exchange rate volatility may also contribute to some variations.
In 2013, however, one can observe an intensification in both imports and exports. This intensification correlates well with, and is likely the consequences of, the feed-in tariff system introduced in 2012 (OECD, 2015) as a measure to handle the energy crisis.
There is a downswing starting in 2015 (we can observe the same pattern in the fossil energy imports and in the USD/JPY rates as well). A phenomenon certainly related to the general recession Japan faced in 2015–2016 (Harding, 2015)1.
Electricity Consumption
It is not clear how we could estimate domestic electricity consumption trends directly from the trade statistics. However, observing that the imports of fossil energy are rapidly losing some steam while the imports of goods necessary for running nuclear plants (that may not be readily available domestically) are still falling off, and considering that the rise in goods related to renewable energy remains somewhat moderate—keeping in mind that, currently, renewable energy sources are far less efficient than nuclear or even fossil energy sources (Layton, 2008)—it becomes natural to infer a reduction of consumption.
This inference appears to be along the right lines, for, e.g., the Electric power consumption (kWh per capita) presented by The World Bank indeed reveals a steady decline in electricity consumption post-Fukushima.
Concluding Remarks
Throughout this kernel, we took a brief look at the balance of trade of Japan obtained from the Japan Trade Statistics dataset. The balance of trade, after having been maintained positive over a long-lasting period, suddenly plummeted between 2010 and 2011 to become largely negative. The abysmal descent stopped in 2013, from which an upturn occurred; in 2016 the balance became again positive. The link to the 2011 devastating tsunami that triggered a nuclear disaster is quite evident, and hard to refute.
Taking a closer look at the data, we established that the anomalistic variation of the net exports was largely caused by a change in energy imports; and then further the analysis of energy imports/exports, which constitutes the bulk of this kernel.
The consensual narrative found in various media about the matter could somehow be inferred from the dataset. After the nuclear fiasco of 2011, all nuclear reactors of the country (producing 30% of the needed electricity at that time) were shut down, pushing the need of importing alternative energy up, hence an immediate increase in fossil energy imports. In the meantime, Japan revised its energy policies to foster the adoption of renewable energy and to reduce electricity consumption; while maintaining a large portion of its nuclear capacity (which is very slowly and extremely cautiously restarting operation). As a result, imports of fossil energy returned to a level somewhat similar to the one pre-Fukushima.
Concerning the dataset, we found some suspicious data (outliers), which suggests the presence of errors in the dataset.
Much of the analysis reposes on the selection of the pertinent HS Codes. Considering irrelevant items or missing relevant ones might lead to vastly different views and conclusions. Besides, the scope and granularity of the harmonized system (HS) itself may not be adequate to obtain a detailed landscape of specific sectors such as nuclear energy or renewable energy.
To avoid jumping to hasty conclusions, many other economic indicators would have to be examined. For example, the financial crisis of 2008–2009 that translated to a massive economic crisis and a global slowdown of the economy, impacted energy trades in a noticeable way (see the 2008–2009 dent in imports/exports in many curves presented above). Extrapolating from this extreme case, regular economics fluctuations alone influence energy trades. So does a black swan (Taleb, 2007) such as the cataclysmic Fukushima accident, which, alone can trigger an energy crisis. To fully understand the complex mechanisms behind the volatility of the balance of trade of a major economy such as Japan, a mixture of highly intricate, interacting interlacingly (and non-linearly) factors have to be shrewdly considered, making the task hard, to the point of plausibly leading to very speculative conclusions or conclusions mostly substantiated by the confirmation bias (Nickerson, 1998). The author has no pretension to being bias-free. ■
License and Source Code
© 2017 Loic Merckel, Apache v2 licensed. The source code is available on both Kaggle and GitHub.
References
- DeWit, A. (2015). Japan’s Bid to Become a World Leader in Renewable Energy. The Asia-Pacific Journal | Japan Focus, 13(39), Article 2.
- Harding, R. (2015). Japan Falls Back into Recession. Financial Times. https://goo.gl/5JYuEA
- Layton, B. E. (2008). A Comparison of Energy Densities of Prevalent Energy Sources in Units of Joules per Cubic Meter. International Journal of Green Energy, 5(6), 438–455. https://goo.gl/2wPMnp
- Morita, K. (2012). Coal Trends. The Institute of Energy Economics, Japan (IEEJ). https://goo.gl/SK8xn7
- Nickerson, R. S. (1998). Confirmation Bias: A Ubiquitous Phenomenon in many Guises. Review of General Psychology, 2(2), 175–220.
- OECD. (2015). OECD Economic Surveys JAPAN. http://goo.gl/XUDKLw
- Soble, J. (2014). Japan’s record trade deficit raises fresh doubts about Abenomics. Financial Times. http://on.ft.com/1z6ExWM
- Taleb, N. N. (2007). The Black Swan: The Impact of the Highly Improbable. Random House.
- Versino, C. (2012). Trade Monitoring for Nuclear and Nuclear-related Dual-use Items—Biological Weapon Convention. https://goo.gl/9ZYivT
- WNA. (2017). Nuclear Power in Japan—World Nuclear Association. https://goo.gl/fuh8Lo
- Wind, I. (2009). Limitations of International Statistics on Climate-relevant Trade—OECD - Global Forum on trade 2009. https://goo.gl/jUqPTb
-
For example, for the item with HS Code 270900100 (one type of crude oil), we can see that the A Series of Data for Commodity search function on Trade Statistics of Japan yields only data from 2006 to 2016, while the demanded range is 1988–2017: Result of Search ↩