Fat Tailed
![]()
Fat-Tailed is a toy webapp that fits typical fat-tailed distributions to financial data. The data selection consists of (i) indexes such as the S&P 500, Nikkei, DAX, CAC 40; and of (ii) cryptocurrencies such as Bitcoin, Ether, Litecoin. This page gives a few details about the distributions and the technology used.
Distributions
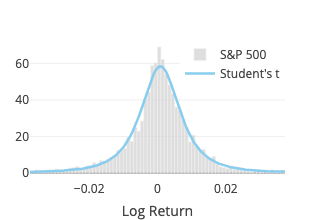
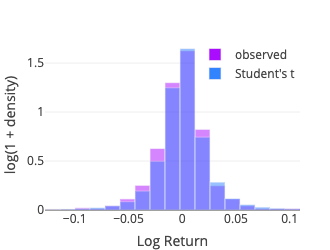
Student’s t
The fit function of scipy.stats.cauchy is used. Three parameters are estimated: degree of freedom, location and scale.
Note that, denoting \(\text{df}\) the degree of freedom, for \(\text{df}=1\), it is a Cauchy distribution, and for \(\text{df} \to \infty\), it becomes a normal distribution.
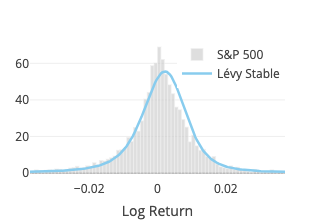
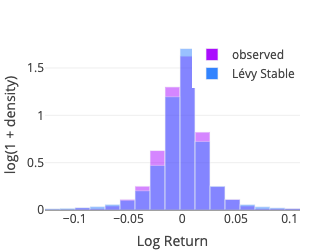
Lévy Stable
The fit function of
scipy.stats.levy_stable turned out to be ridiculously slow, to the point of not being usable for a pseudo-realtime webapp.
Instead we rely on the pylevy module (source code available on GitHub).
Four parameters are estimated: alpha, beta, location and scale.
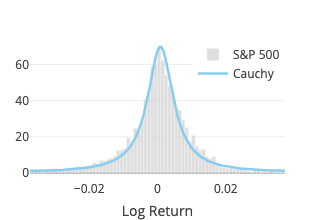
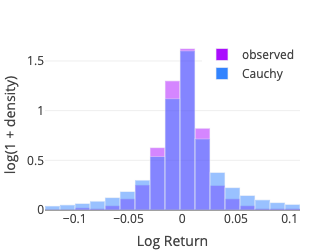
Cauchy
The fit function of scipy.stats.cauchy is used. As mentioned above, it coincides with the Student’s t distribution with one degree of freedom. Two parameters are estimated: location and scale.
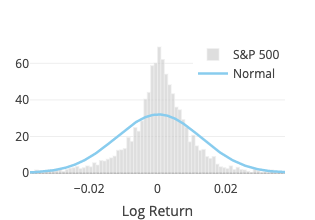
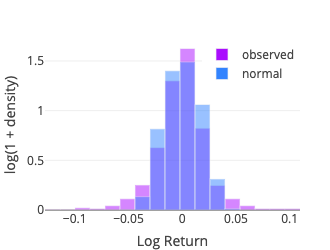
Normal
Although the normal distribution is not fat-tailed, it provides a good reference to compare with other distributions (for the normal distribution is arguably the best known and most used—and misused—distribution). It also gives some insights on why one should worry about using risk measurement such as the value at risk (VaR) using the Variance-Covariance Method based on a normal distribution (see, e.g., Risklet).
The fit function of scipy.stats.norm is used. Two parameters are estimated: location (\(\mu\)) and scale (\(\sigma\)).
Goodness-of-Fit
When one wants to determine whether an observed sample is drawn from a specific continuous distribution, the Kolmogorov-Smirnov goodness-of-fit test may first come to mind. However, here we estimate the distribution parameters using the sample (and thus the fitted distribution and the sample are not independent), which may add some level of complexity in order to meaningfully perform this test (Wikipedia, 2021).
Instead we use the Pearson’s chi-squared test which compares an observed (frequencies) distribution against a theoretical (expected) distribution. To compute the test statistic we binned the sample using the method numpy.histogram with the bins parameter set to ‘doane,’ for the Doane’s formula may work better for non-normal data (Doane, 1976). Some details about the different binning options are documented in numpy.histogram_bin_edges. The expected frequency for each bin is then computed using the middle point (x-axis) with the relevant probability density function (pdf function from the scipy.stats package).
Some Technical Aspects
This webapp is developed using Dash Open Source (both the back end and the front end). It currently runs on (hosted by) Google App Engine, which has the great advantage to offer a free quota. Cloud Firestore is used for caching data. A custom back end relying on Firestore for Flask-Caching has been implemented. This may sound a bit peculiar, for one might point out a typical use case for Flask-Caching (more generally caching) is to (i) alleviate the database storage load and (ii) provide a faster mechanism for retrieving the data. The reason for using Firestore lies in the fact that Firestore comes with a free quota, whereas the Google Memorystore for Redis does not.
The server is located in Germany and the App Engine configuration is set to keep the resources consumption within the free quota. Consequently, the app may appear quite slow to many users.
Acknowledgement
The ‘Financial Report’ dashboard from the Dash App Gallery has been used for building this webapp. The source code is available on GitHub.
The data are fetched from Yahoo! finance (via the yfinance library).
References
- Doane, D. P. (1976). Aesthetic frequency classifications. The American Statistician, 30(4), 181–183.
- Wikipedia. (2021). Kolmogorov-Smirnov test—Wikipedia, The Free Encyclopedia. https://bit.ly/2S4JAev